DESCRIPTION:
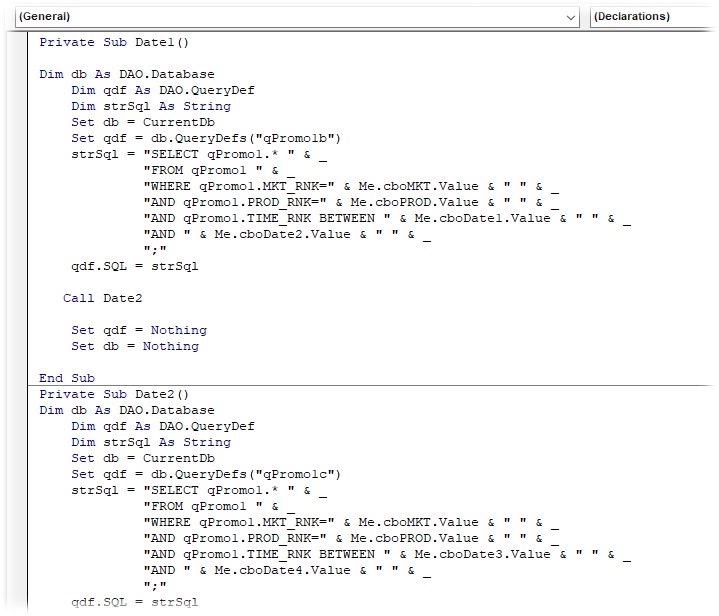
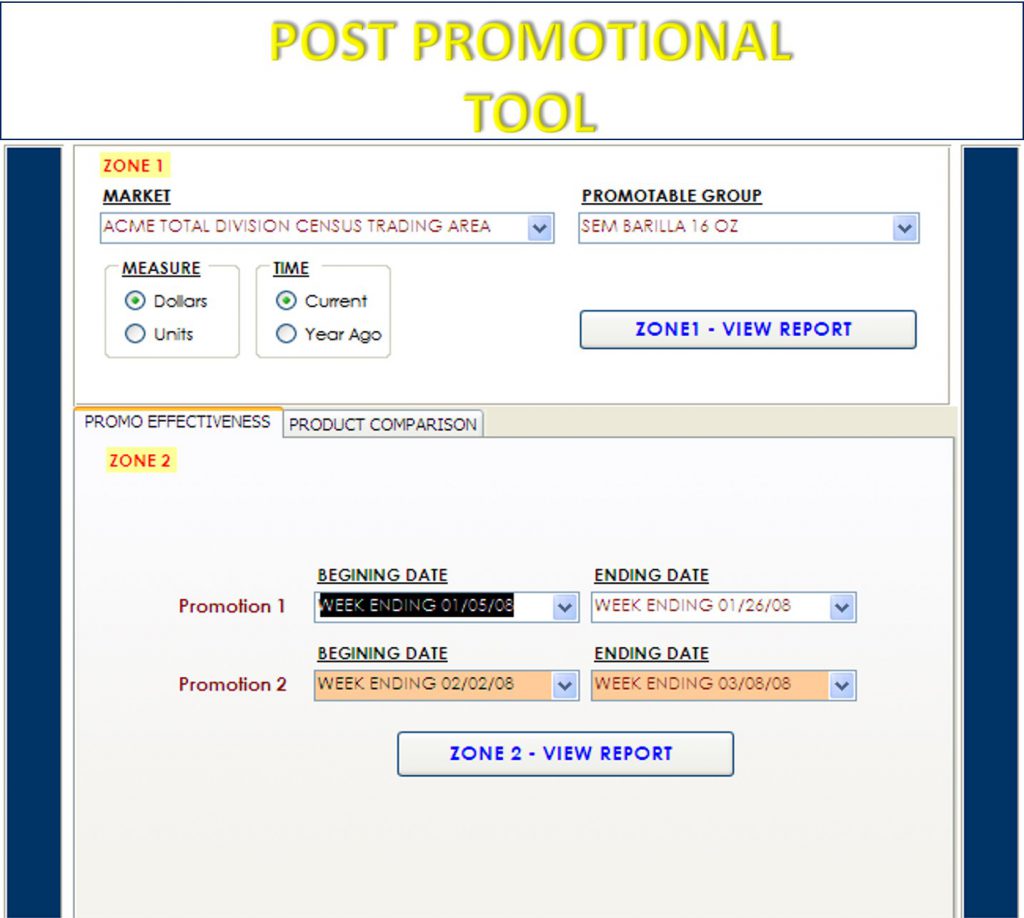
Created and designed the automated Post Promotion Evaluation Tool utilizing Microsoft Access VBA/SQL.
BUSINESS PURPOSE:
- Evaluate which promotions were most effective in driving incremental volume
- Assess the impact of pricing, causal activity, and promotional timing
- Review brand seasonality and determine the best time of year to promote
- Measure the effectiveness of competitive promotions and the impact on Private Label
- Use to forecast volume when developing business plans (internal)
DIMENSIONS:
- DATABASE SOURCES: Nielsen or IRI
- PRODUCTS/PROMOTABLE GROUPS: Key Categories/Segments
- TIME PERIODS: 52 (1 week) Current & 52 (1 week) Year Ago
- GEOGRAPHIES: Retail Trading Areas & Rest of Market
- MEASURES: Dollar Sales, Unit Sales
END USER EXPERIENCE:
- Collaborated with stakeholders such as business leaders, sales managers, and category managers to gather data requirements and align on KPIs
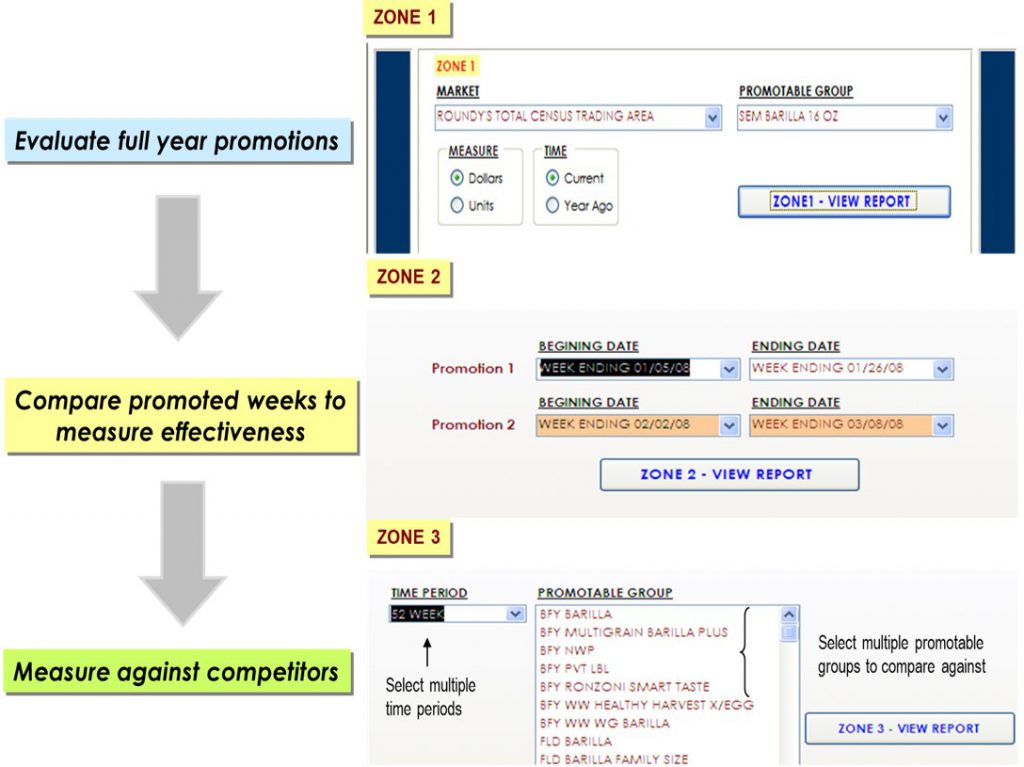
- Designed the tool for easy navigation and minimal selection criteria
- Reports are automatically generated at the click of a button
- Updated and delivered the tool monthly based on the database refresh
PROMOTION SUMMARY REPORT (DOLLARS & UNITS):
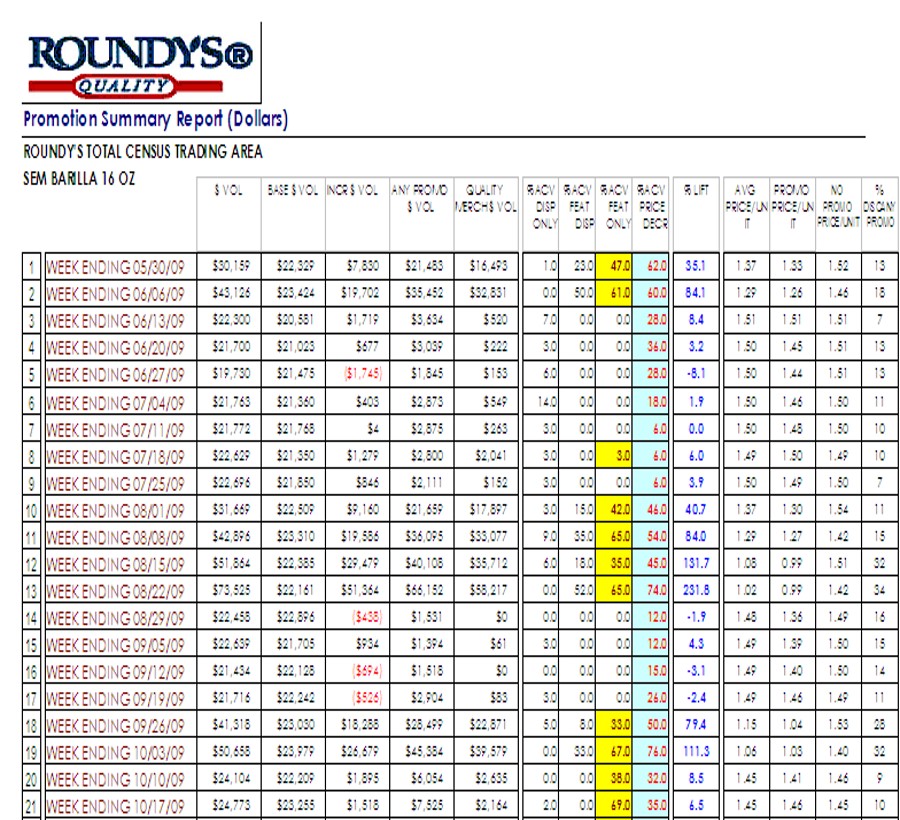
- Analyze promotional activity for the full year (current & year ago)
- Feature weeks highlighted
- Top selling weeks identified for the following measures:
- Dollar/Unit Volume, Incremental Volume, % Lift, % ACV Feature Only, & %ACV TPR
- Compare & determine promotional effectiveness for two promotional events
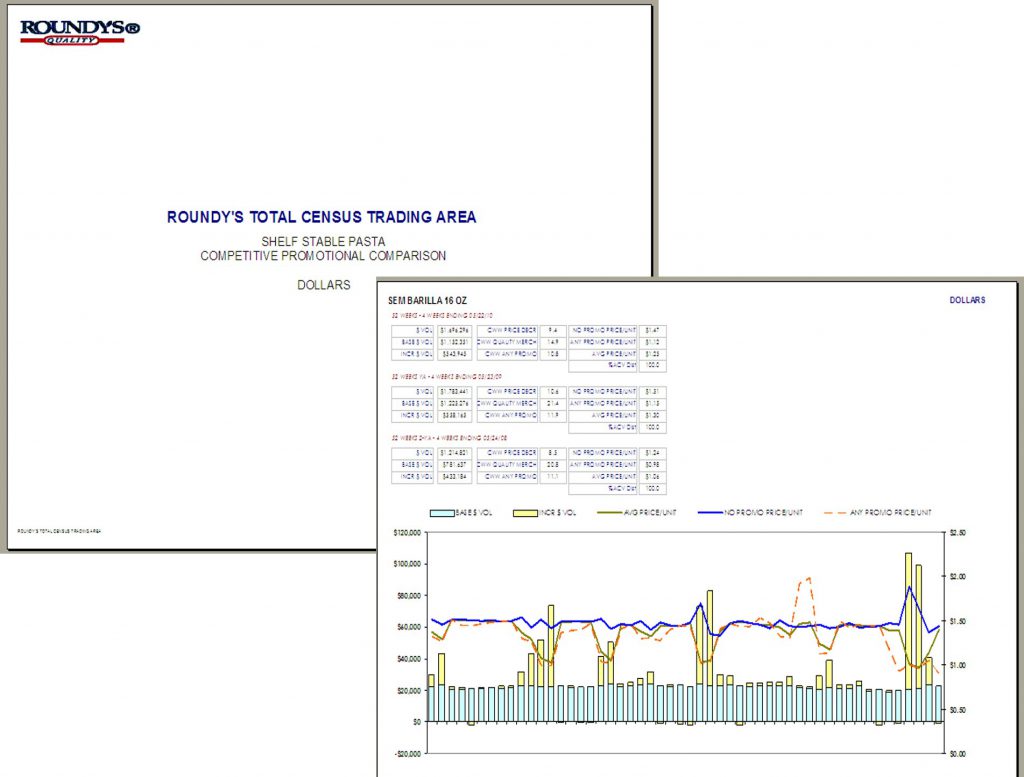
COMPETITVE PROMOTIONAL COMPARISON REPORT (DOLLARS & UNITS):
- Includes 2 year topline trend performance
- Charts base, incremental, & price
- Compares against multiple promotable groups
SAMPLE CODE:
Integrated and transformed data from various sources by writing SQL queries and coding VBA modules
